Creating customized nautical charts using the latest data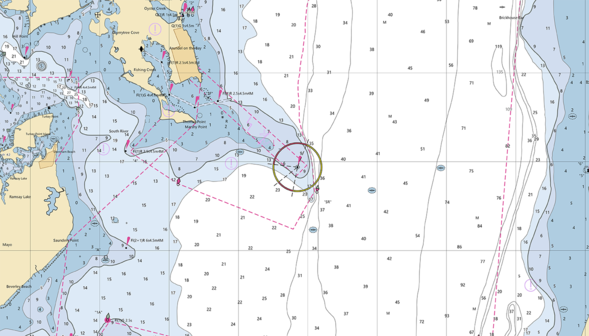
An image showing the output of the NOAA Custom Chart application with a chart covering the western side of the Chesapeake Bay. Nautical charts have always contained a great amount of information – even more so with electronic navigational charts. This information is constantly being updated, necessitating the need to keep your nautical chart suite as current as possible. NOAA’s Office of Coast Survey’s online NOAA Custom Chart application enables users to create nautical charts directly from the latest official NOAA electronic navigational chart (NOAA ENC®) data. Users now have the ability to create their own nautical charts using individually set parameters, and then save this custom nautical chart as a file that can be viewed or printed. Read more NOAA Partners with U.S. Navy to Establish A New PORTS® in Washington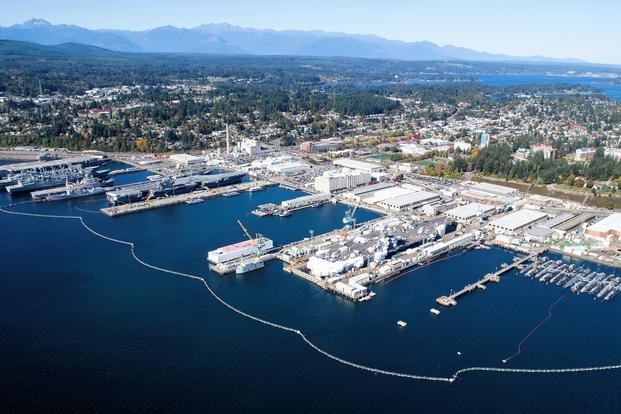
Aerial view of Naval Base Kitsap-Bremerton, Puget Sound Naval Shipyard and Intermediate Maintenance Facility. (Credit: U.S. Navy/Naval Base Kitsap) On June 13, NOAA announced a new partnership with the U.S. Navy to establish a new Physical Oceanographic Real-Time System (PORTS®) at Naval Base Kitsap, the Nation’s third-largest Navy installation and home of the largest fuel depot in the Continental U.S. NOAA has now established 37 PORTS® across the Nation through advanced technology and strong regional partnerships. PORTS sensor data is an invaluable decision support tool for the maritime community, and is used daily by professional and recreational mariners to safely navigate constantly changing weather and water conditions. The system near Naval Base Kitsap, Kitsap PORTS, consists of two current meters and one new water level and meteorological monitoring station. Its integrated sensors provide critical real-time information on oceanographic and meteorological conditions to improve navigation safety of vessels entering and exiting Puget Sound, Hood Canal, and Rich Passage. View the real-time data for the Kitsap PORTS here. Last summer, NOAA’s National Geodetic Survey introduced new web-based tools for submitting geodetic survey data through its Online Positioning User Service (OPUS) Projects 4.0, allowing users nationwide to increase the number and volume of submitted survey data. Web-based tools offer an easy, intuitive way to manage and process geodetic survey projects involving multiple sites and multiple occupations. A quote in a recent California Department of Transportation newsletter called the tool “a great way to process, manage and share high-quality geodetic control with the geospatial community. It can reduce time spent researching by having data in a nationally maintained, recognized, and accessible online location.” The National Geodetic Survey relies on federal, state, and local partners to supply geodetic-quality data to maintain the National Spatial Reference System. NOAA focuses on the Great Lakes for the 2022 field season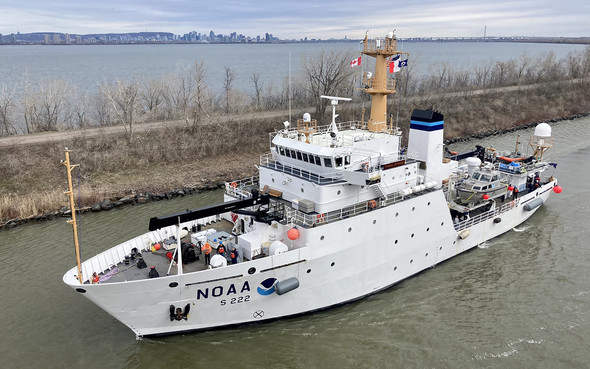
NOAA Ship Thomas Jefferson shown from the bridge wing of a passing ship outside of Montreal, Quebec. (Credit: St. Lawrence Seaway Pilots) In 2022, NOAA and NOAA contractors will survey U.S. coastal waters and beyond, including multiple missions in the Great Lakes. As the volume, value and size of marine vessels in U.S. waters continues to grow, it is essential that NOAA increase the accuracy and frequency of surveys. A great amount of data on nautical charts of the Great Lakes is more than 50 years old, and only about 5 to 15 percent of the Great Lakes are mapped to modern standards using remote sensing methods such as light detection and ranging and sound navigation and ranging. Read more New Meteorological Station On Narragansett Bay Enhances Local Maritime Safety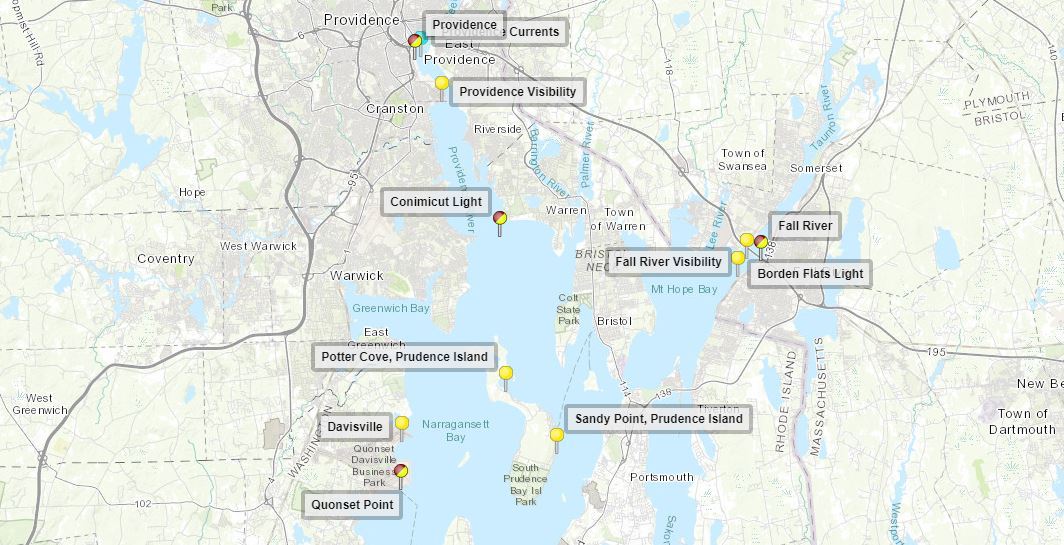
Narragansett Bay PORTS is made up of several types of sensors including water level and meteorological stations, and a current meter. The NOAA’s Center for Operational Oceanographic Products and Services worked with the Rhode Island Department of Emergency Management, one of NOAA’s local partners for the Narragansett Bay PORTS®, to install a new meteorological station at the Davisville Terminal. Located within the Quonset Business Park in the Port of Davisville, Rhode Island’s only public port, the new meteorological station delivers wind, air temperature, relative humidity and air pressure data to the community. Access to site-specific wind data at this location will enhance the safety and efficiency of navigation for Narragansett Bay PORTS®. Davisville is one of the top ten auto importers in North America. In the near future, there will be growing utilization of this facility for wind turbine equipment, due to its proximity to several offshore wind farms. Ocean and coastal mapping matching fund opportunity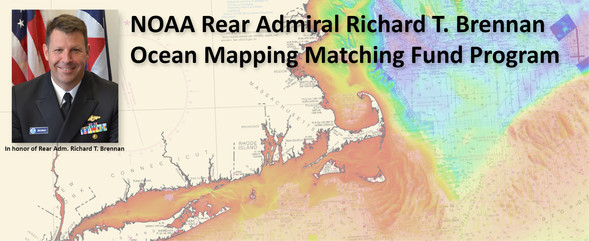 NOAA’s Office of Coast Survey invites non-federal entities to partner with NOAA National Ocean Service’s ocean and coastal mapping programs on jointly funded projects of mutual interest using NOAA’s geospatial contracting vehicles. Known as the Brennan Matching Fund, the opportunity relies on NOAA’s mapping, charting, and geodesy expertise, appropriated funds, and its authority to receive and expend matching funds contributed by partners to conduct surveying and mapping activities. Partners benefit from this opportunity by leveraging NOAA’s contracting expertise, including its pool of pre-qualified technical experts in surveying and mapping as well as data management to ensure that the mapping data are fit for purpose and are usable for a broad set of purposes, including, for example, safe navigation, integrated ocean and coastal mapping, coastal zone management, renewable energy development, coastal and ocean science, climate preparedness, infrastructure investments, and other activities. NOAA’s Office of Coast Survey invites non-federal entities to partner with NOAA National Ocean Service’s ocean and coastal mapping programs on jointly funded projects of mutual interest using NOAA’s geospatial contracting vehicles. Known as the Brennan Matching Fund, the opportunity relies on NOAA’s mapping, charting, and geodesy expertise, appropriated funds, and its authority to receive and expend matching funds contributed by partners to conduct surveying and mapping activities. Partners benefit from this opportunity by leveraging NOAA’s contracting expertise, including its pool of pre-qualified technical experts in surveying and mapping as well as data management to ensure that the mapping data are fit for purpose and are usable for a broad set of purposes, including, for example, safe navigation, integrated ocean and coastal mapping, coastal zone management, renewable energy development, coastal and ocean science, climate preparedness, infrastructure investments, and other activities.
Read more Great Lakes Stations Now Available in Coastal Inundation Dashboard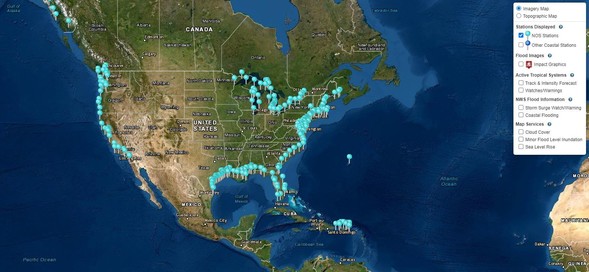
The Coastal Inundation Dashboard is a decision support tool that helps communities anticipate and monitor what sea levels will do along the coast in the short-term and plan for the impacts of a high water event. In the wake of record or near-record Great Lakes water levels in 2019 and 2020, NOAA’s Center for Operational Oceanographic Products and Services has added 50 Great Lakes water level stations to the Coastal Inundation Dashboard. Real-time and historical water levels are available through the web-mapping application, overlaid upon National Weather Service flood impact thresholds (where available). In addition, users now have the ability to view up to 20 water level stations on a single page via the Multi-Station View feature, allowing them to easily monitor water levels across an entire lake or region. Planned improvements over the next several months to this feature include adding historical station top-ten water level data, the integration of National Ocean Service Operational Forecast System model guidance and display of U.S. Army Corps of Engineers 6-month lake-wide water level forecast information. Emergency Response Imagery Updated for 2022NOAA’s National Geodetic Survey released this year’s emergency response pre-event imagery. Coverage includes the East and Gulf coasts, Puerto Rico, and the Virgin Islands. Images for the West Coast have also been collected and should be available in the next two months. These image releases support emergency response efforts and allow for quick comparisons as responders analyze the areas hardest hit by events such as hurricanes, tornados, and floods. This imagery is also available on the NOAA Open Data dissemination site. | 


Be the first to comment!